![]()
Analytical Paragraph Format Examples Exercise
Table of Contents
In this article, I’m excited to help you understand the Analytical Paragraph Format Examples Exercise, which is important in the CBSE Class 10th Board Exams. These exercises help you improve your thinking and writing skills. They let you explore a topic deeply and share your ideas clearly. Since the board exams are a big deal for your studies, learning how to write a good Analytical Paragraph in English can really help you get a good grade.
Being able to analyze and explain different subjects in a brief way is not only useful for school success but also for talking effectively in real life. So, if you want to do well and stand out from your classmates, it’s a great idea to learn about the Analytical Paragraph Format.
Analytical Paragraph Format Examples Exercise
What is an analytical paragraph?
Analytical Paragraph writing – An analytical paragraph is a form of descriptive writing which is written on the basis of a given chart, graph, data, outline, clues, table, etc. When writing an analytical paragraph, one should remember to describe the facts in the best possible manner and to cover the information provided.
The analytical paragraph has to be written in around 100-120 words. So the paragraph must use clear and crisp language along with providing complete details of the chart given in the question. There will be an internal choice given.
You need to attempt one question out of the two questions of analytical paragraphs given as a choice. The question carries 5 marks.
Features of an analytical paragraph writing-
- It describes the given chart, table, data, graph, cues etc.
- It should be brief and comprehensive (include complete information) at the same time.
- It should state facts that are provided by the chart.
- It is necessary to make use of simple and accurate language.
- It should mention figures and quantities appropriately.
- It is appropriate to use the same tense throughout the analytical paragraph.
- No personal observation or response should be provided.
- It would be preferable to use the passive form of the verb.
Analytical Paragraph Format
Analytical Paragraph Writing Format
An analytical paragraph shall be divided into three parts-
- Introduction
- Body of the paragraph and;
- Conclusion
Format of Analytical paragraph writing

How to Write Analytical Paragraph
- The introduction
The introduction is the first paragraph that should describe in brief what the graph is about. It should be like an opening paragraph that introduces the reader to the context of the chart given. When writing the introductory paragraph, you need not go into the details. You just need to mention what is clearly evident from the chart or the graph given in the question. It is best to write the introduction in one or two lines.
- The body of the paragraph
This part of the analytical paragraph should contain details of the graph/chart given in the question. It should contain all the important information. It is extremely important to choose the significant details that should be included in the paragraph.
The body can be broken into two or three sub-paragraphs depending on the information extracted from the graph. Breaking the body into subparagraphs makes it easy for the reader to understand.
i. Organizing information: You should look for the large differences that are very prominent. You can mention the aspect which is the smallest or the largest in the data given. Any aspects that are similar should be mentioned next. You should further mention about the aspect that has remained unchanged or constant throughout.
ii. Comparing information: If the chart mentions two different parties, for example, men and women, refer to both of them in the analytical paragraph. If there is any contrast or comparison that could be drawn, you must present it effectively. If the chart is about a particular time period or highlights trends of several years, mention each year in a concise manner. If any comparison or contrast can be done for two or more years, you should write about it too.
iii. Mentioning quantities: When including numbers and figures, their accuracy must be ensured. There are a number of ways that can be used to describe quantities, for example- percentage, fraction, ratios, etc.
- Connecting sentences:If different information or ideas are there, you should use connectors or linking phrases to link them logically. The sentences of the paragraph should be sequential and connected rationally.
- The conclusion
The last paragraph should summarise the idea mentioned and the information in general. It should be concluding in nature and act as the closing statement. One should keep in mind that one must not include any personal opinions, conclusions, or observations. You should simply stick to the facts.
You need not dispose of the information to write a good analytical paragraph. The key is to choose wisely the important information, organize it well, state correct facts and summarise it properly.
Useful Tips for Writing an Analytical Paragraph
- For an introduction, you can start with the following phrases-
- The chart given above describes
- The table suggests
- The line graph shows
- The data given provides information about
- The pie chart illustrates, etc.
- For describing trends, use phrases and words like- a pattern of growth, rapidly doubled, skyrocketed, striking increase, peaked, soaring rates, declined, plummeted, leveled off, stagnated, fluctuate, starting to rise, starting to fall, drop down, slightly, etc.
- For describing quantities, use various styles like- 48% of, one-third of, nearly one-fourth of, almost 80%, majority, on average, twice as much, almost equal, the highest, the lowest, very close to 2%, roughly, approximately 5% of, just under three percent, etc.
- For establishing a relationship or contrast, use phrases and words like- relationship between, similarly, in contrast with, in comparison to, but in the opposite case, however, whereas, when it comes to, as opposed to, while, striking difference, noticeable difference, etc.
- For the conclusion and other connecting phrases use- overall, subsequently, in all, in a nutshell, for the chart given, in short, striking changes, including, therefore, etc.
Analytical Paragraph Format Examples Exercise
Analytical Paragraph Solved Exercise
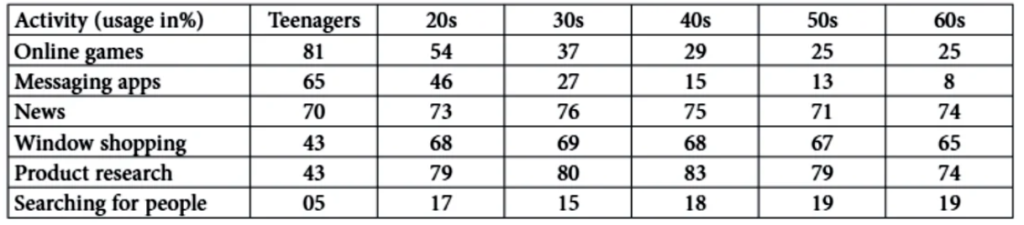
1. The following table shows details about the internet activities for five categories for different age groups. Write an analytical paragraph for the table given in 100-120 words.
Answer
The given table illustrates the internet activities of six age groups ranging from 15 years to those in their sixties for six different kinds of activities. The table shows that those in their teens spend more time on online games and news, while the older generation spends time on the internet browsing for products and to do window shopping. It is clearly evident from the table that teens mainly use the internet for online games (as high as 81%) 70% of them use it for news and 65% use it for messaging and the least they use it to search for people which consists of only 5%. Those who belong to middle age group, i.e., people in 20s to 50s are highly interested in getting news, doing product research and window shopping, the percentage ranging from 70-80%. The internet activity which is least used by people is to searching for people on internet. All the age groups spend only 50% to 20% of their time on the same. The amount of time spent to use messaging apps to text others decreases with age and gets as low as 10% for those in their 60s.
In a nutshell, the above table suggests that teenagers are most interested to spend time on playing games and sending messages to their friends and relatives. On the other side, older people are interested in researching and doing window shopping. Overall, people are likely to spend the least amount of time searching for other people on internet.
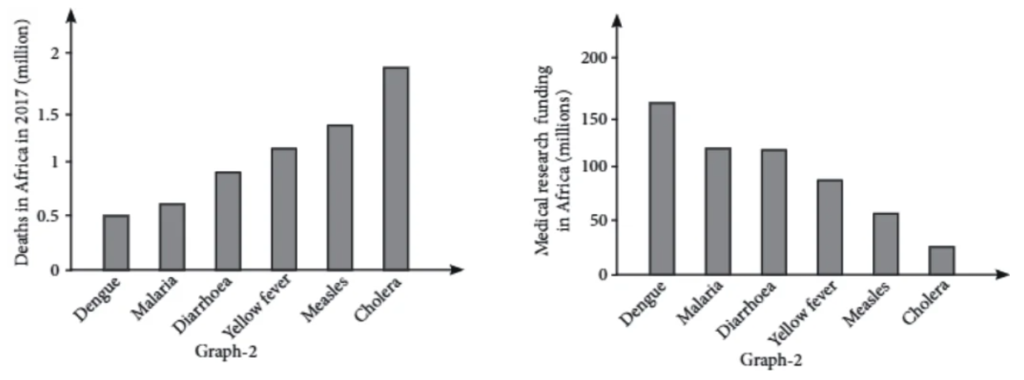
2. The bar graph compares the number of deaths caused by six diseases in 2017 in different states of the African regions with the amount of research funding allocated to each of those diseases. Summarise the information and write an analytical paragraph in 100-120 words and also make comparisons where relevant.
Answer
The bar graph compares the number of deaths caused by six diseases in 2017 in various states of the African region with the amount of research funding allocated to each of those diseases. It can be clearly seen that the amount of research funding in many cases did not correlate with the seriousness of the disease in terms of number of deaths.
In 2017, there were around 0.4 million deaths from dengue, 0.6 million deaths from malaria, 0.9 million death from diarrhoea, 0.2 million deaths from yellow fever, 1.4 million deaths from measles and 1.8 million deaths from cholera. In 1990, dengue received 100 million dollars in research funding, malaria and diarrhoea both received 120 million dollars in research funding, yellow fever received 83 million dollars, measles received 60 million dollars and cholera received 35 million dollars in research funding. In conclusion, the given data clearly states that funding allocation for disease research in Africa is not completely determined by the number of deaths for which each disease is responsible in given year.
However, the disease which is less fatal has a significant funding amount whereas cholera, the most fatal disease has received only 35 million dollars for research funding.
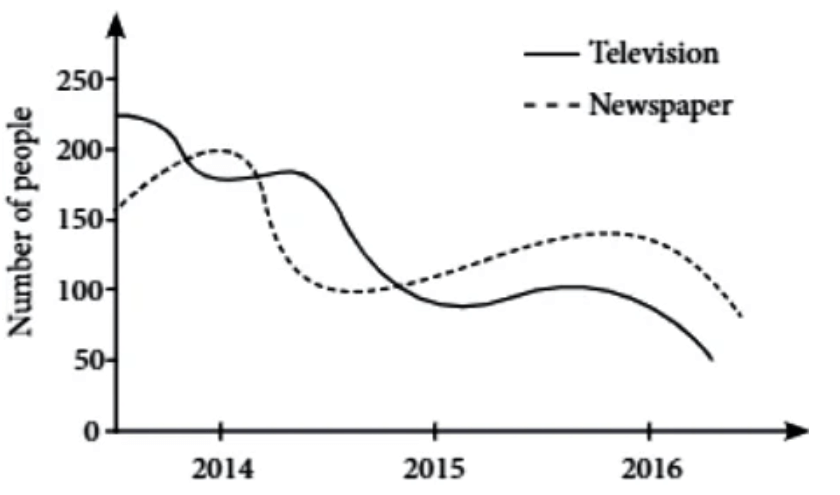
3. The given paragraph shows the decline in the use of television and newspaper with the excessive use of smartphones over the span of three years. Write an analytical paragraph in 100-120 words describing about the given information.
Analytical Paragraph Format Examples Exercise
Answer
The given line graph illustrates the decline in the use of television and newspaper with the excessive use of smartphones over the span of three years. The graph shows that in the year 2014 there were around 180 people who were using television, then there is a huge decline towards 2015 where only 85 people were interested in using it and then there is a continuous downfall in the number people which levelled off to only around 72 people in 2016.
On the other side, there were around 200 people who are likely interested in reading newspaper rather than watching television. It stagnated to 190-150 people for the next few months and started to fall with a drop down of around 80 people in 2015. The number of people interested in reading newspaper shows a striking increase in the next few months which has reached 130 people in 2016. Overall, the graph shows that there is a huge decline in the use of television and newspaper but there were still more people who were using newspaper in comparison to the use of television.
However, the excessive use of smartphones has declined the usage of television and newspaper. In 2016 television has become less popular among people whereas newspaper is still preferred over television by many of them.
English For CBSE Class 10th Board Exams
Letter to Editor Showing Concern
Letters to The Editor for classes 8 to 12
Useful Tips For Effective Writing
Discursive Passage For CBSE Class 10th Board
Important Passage for 10 CBSE Board


